Dashboard & map
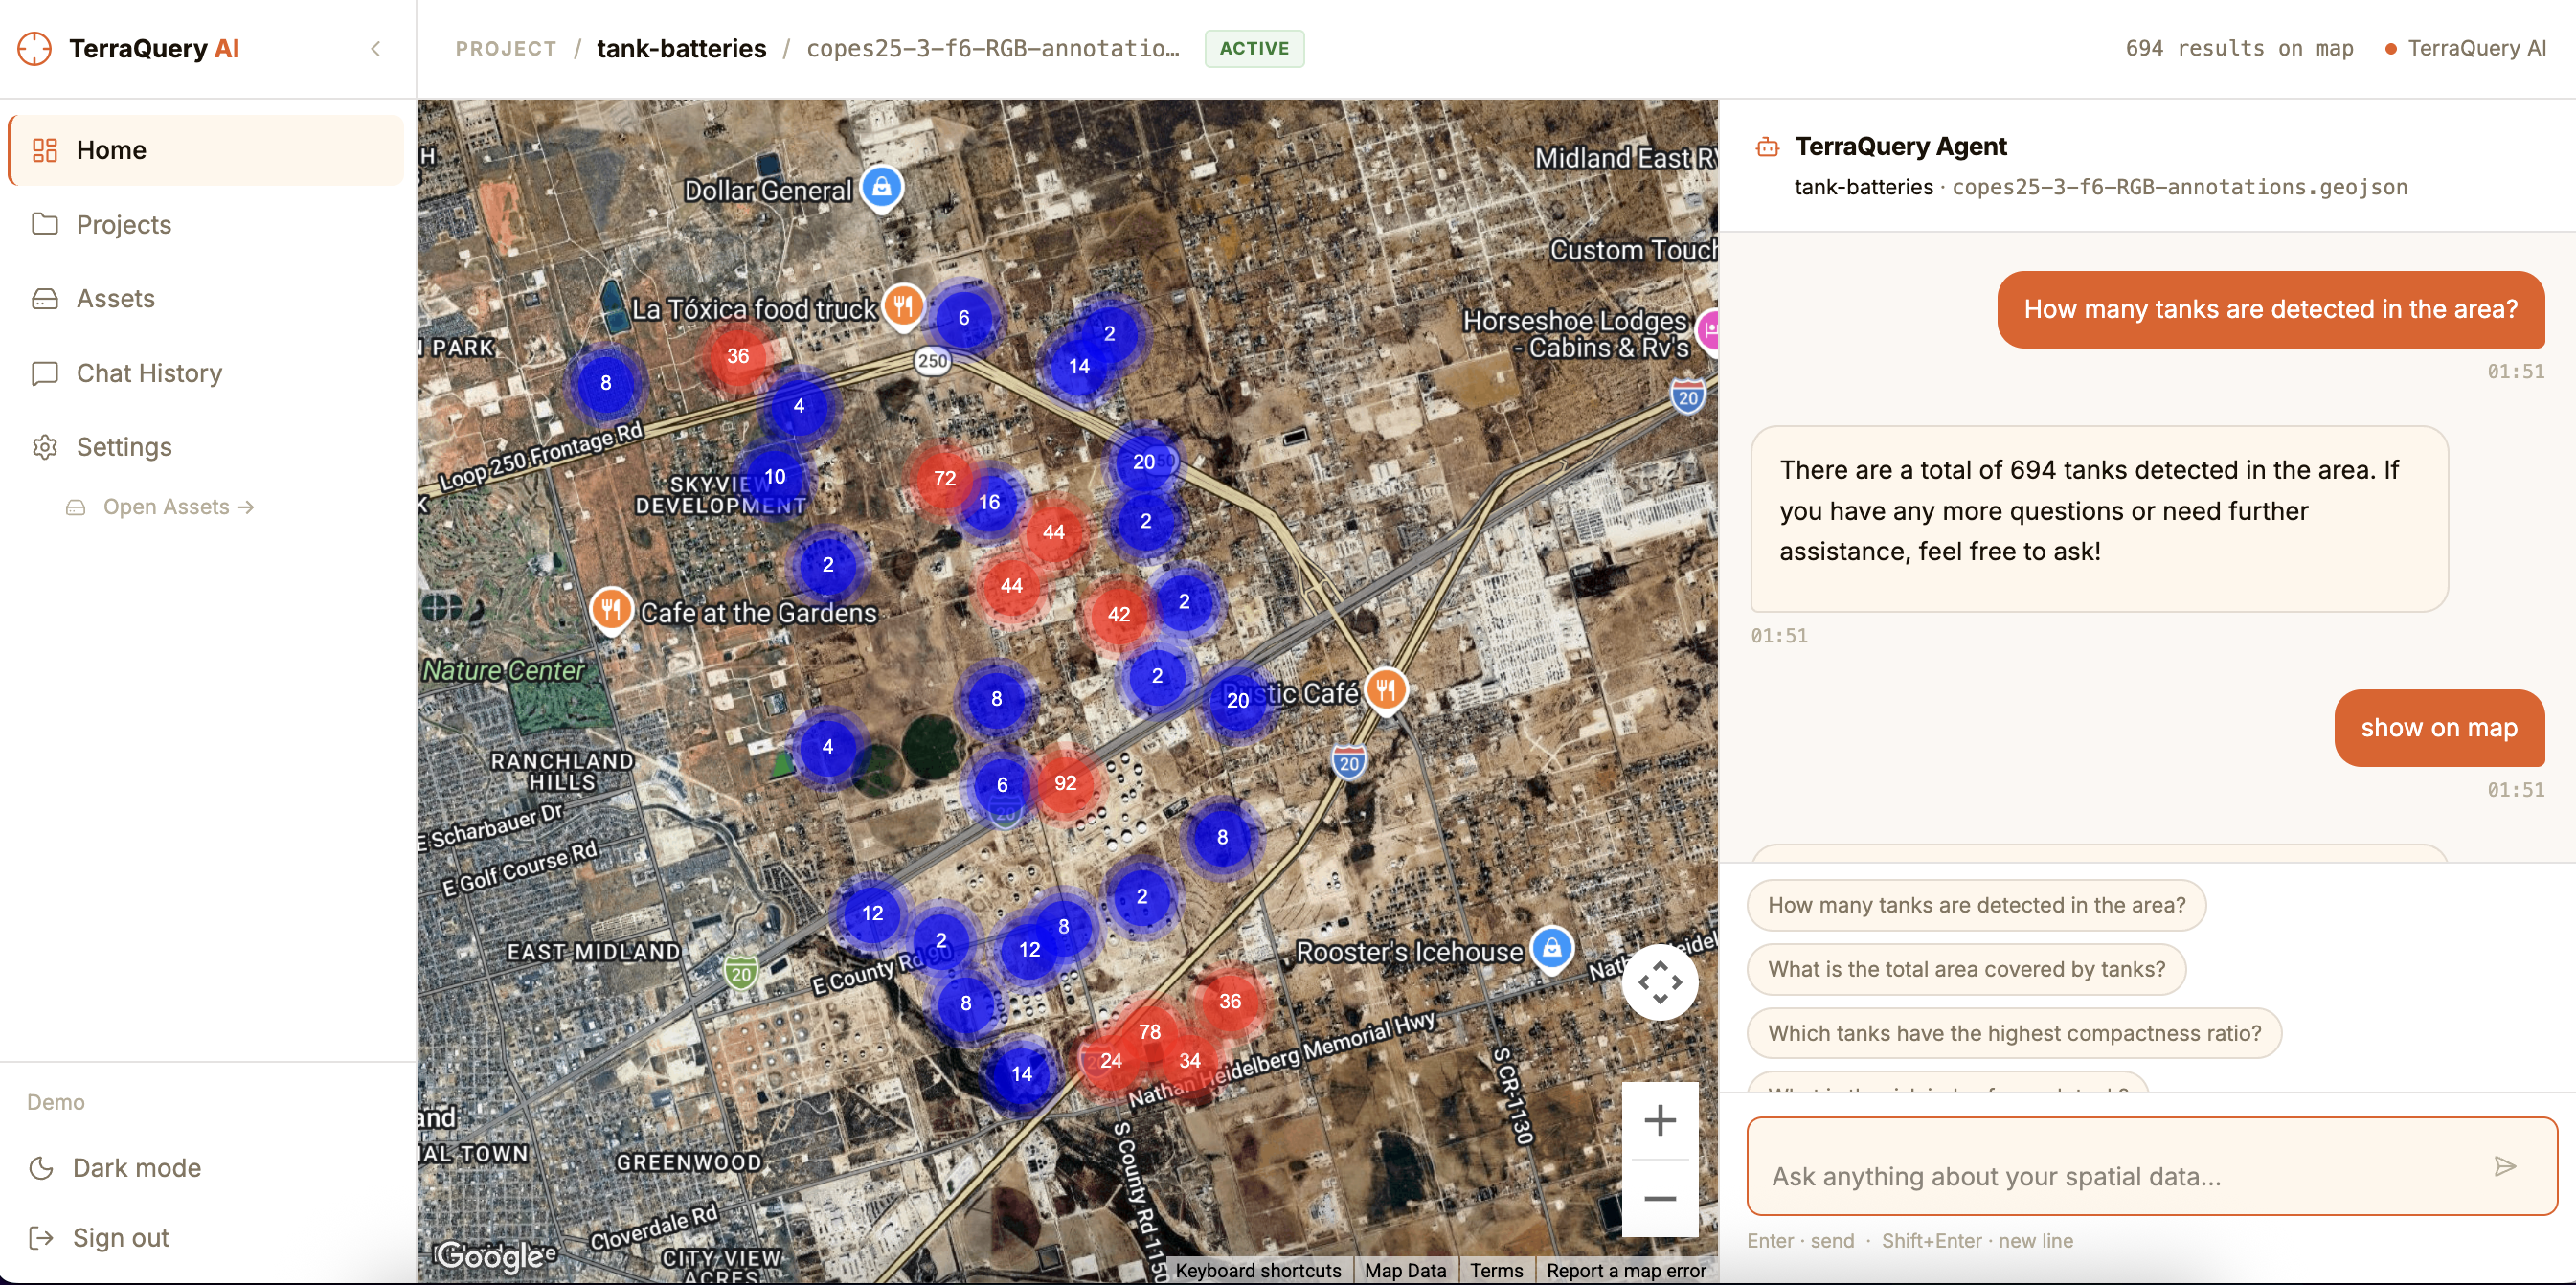
The Dashboard is the main workspace — a full-screen map with the chat panel alongside it.
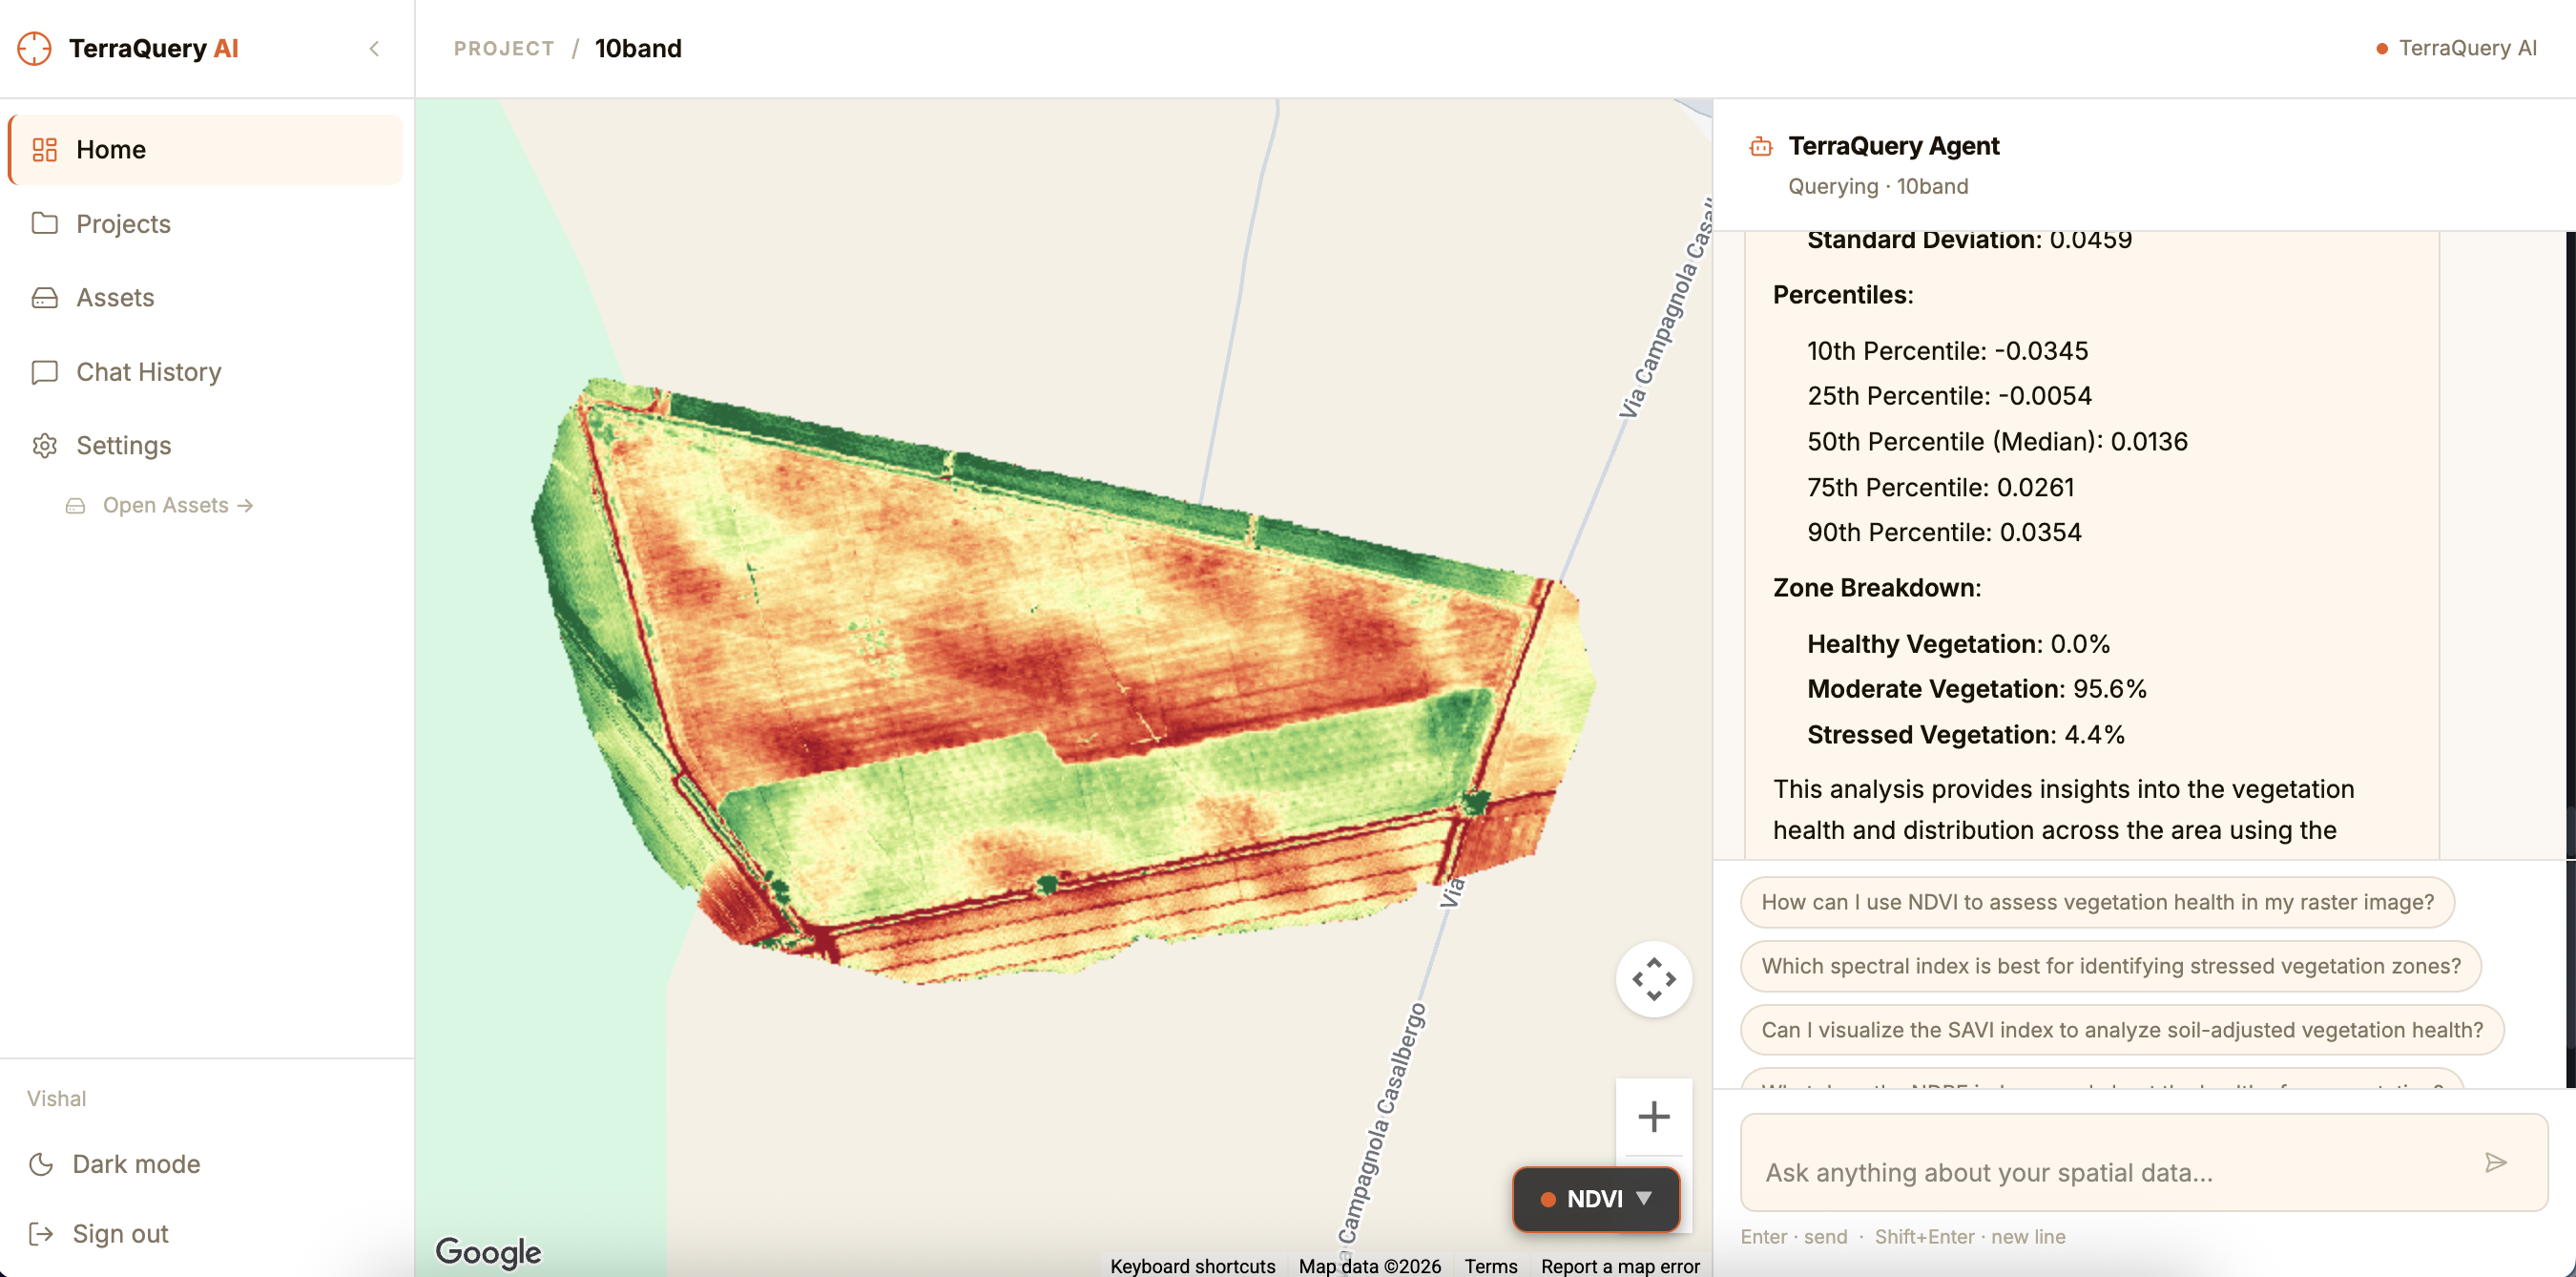
Loading an orthomosaic on the map
Via Analyze: Click Analyze on the Assets page. This is the recommended path.
Via "View on map": On the Assets page, TIFF files show a purple View on map button. Click it to jump to the Dashboard with that ortho loaded.
Via sidebar: Click the Assets icon in the sidebar to open the asset quick-picker and select an ortho.
Map controls
The map is a satellite base map. The orthomosaic is overlaid as tiles:
- Zoom — scroll wheel or pinch
- Pan — click and drag
- Fit to ortho — the map automatically fits the ortho bounds when it first loads
True-color (RGB) view
By default, the ortho is rendered in natural color (RGB). This is the RGB mode shown in the index selector.
Switching spectral indices
When an orthomosaic is loaded, an index selector appears above the map (or in the chat panel header area). Click any index button to switch the visualization. The map tiles reload instantly.
See Spectral indices for a full description of all indices.
GeoJSON overlay (query results)
When you ask a spatial question in chat, matching features are highlighted on the map as colored markers or polygons. The count is shown in the top bar: N results on map.